

Top-down, bottom-up, proxies, trade data and field checks: how to build a market estimate you can defend, even without reliable published statistics
“How big is the market?” is usually the first question a company asks before entering a new country. In many African markets, the answer cannot simply be bought. Syndicated retail panels may cover only some categories, official statistics can be dated or aggregated, and a large share of trade flows through informal channels.
Scarce data does not make market sizing impossible. It makes method essential. A credible estimate comes from combining several imperfect sources, testing them against each other and being transparent about uncertainty. Here are the practical methods that work.
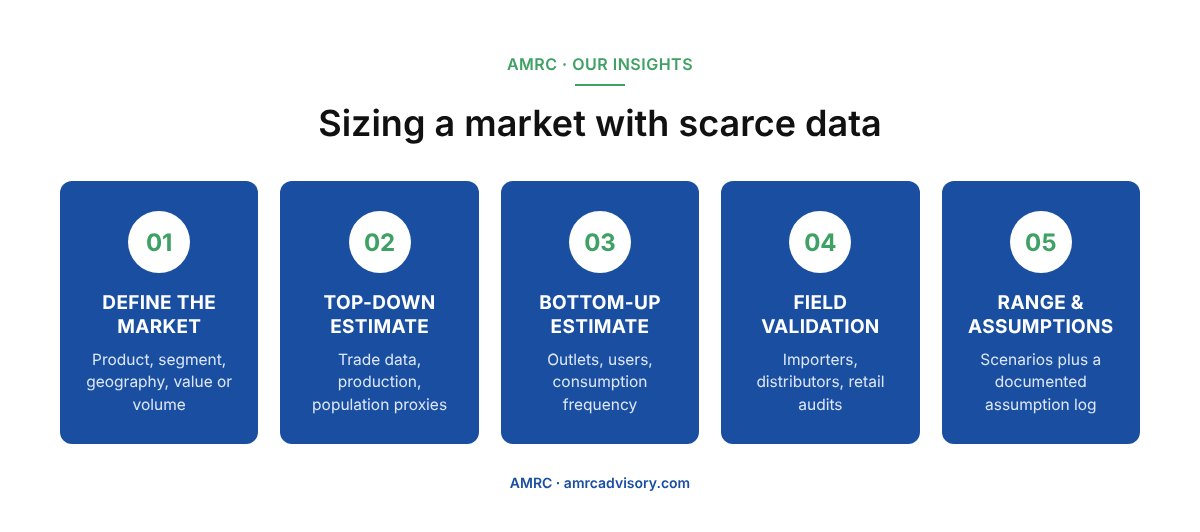
1. Define exactly what you are sizing
Many sizing exercises go wrong before any number is calculated. Agree first on the scope: which products and price segments, which geography, which channels (modern, traditional, informal), and whether you need volume, value or both. Clarify also whether the target is the total market, the addressable market for your offer, or the share you could realistically capture. For example, the market for packaged dairy products in the capital city’s modern retail is very different from total dairy consumption nationwide, including loose milk sold in markets. Both numbers can be useful, but they answer different questions.
2. Top-down: start from the big picture
A top-down approach starts from aggregate data and narrows it down. In markets that rely heavily on imports, trade statistics are often the most useful starting point.
- Trade data: import and export volumes by HS code from national customs and international trade databases, adjusted for re-exports.
- Local production: industry associations, company reports and sector studies.
- Apparent consumption: production plus imports minus exports, adjusted for stock changes where known.
- Population proxies: households, urban population, income bands or penetration of related products.
Top-down estimates are quick, but they can miss informal imports and smuggled goods, and HS codes often mix products you need to separate.
3. Bottom-up: build from units you can observe
A bottom-up approach multiplies observable units: number of users times consumption frequency times average price, or number of outlets times average sales per outlet. The inputs come from primary research.
Supply-side interviews
Importers, distributors, wholesalers and manufacturers’ agents know their volumes and those of their competitors far better than any database. A series of structured interviews with these players, cross-checked against each other, often provides the backbone of the estimate.
Retail audits and outlet counts
Counting outlets in sample areas, recording which brands are present and estimating stock rotation gives a grounded view of the distribution channel, including traditional shops that no panel covers.
Consumer surveys
A survey measures penetration, purchase frequency, quantities and prices paid. It works best when the sample reflects the real population, which in many cases means face-to-face interviews beyond the main cities.
4. Triangulate and use proxies wisely
The strength of a market estimate comes from convergence. When top-down and bottom-up results land in a similar range, confidence increases. When they diverge widely, the gap itself is informative: it may reveal informal trade, a segment you have missed or a wrong assumption on consumption.
When direct data is missing, proxies help: a comparable country at a similar income level, a related product with known penetration, or a ratio observed in another market. Use them as a check rather than a foundation, and explain why the comparison holds.
A defensible range built on documented assumptions is worth more than a precise number nobody can explain.
5. Present ranges and scenarios, not a single number
In data-scarce markets, a single figure suggests a precision that does not exist. A better format is a low, central and high scenario, each linked to explicit assumptions. Decision-makers can then see which variables matter most and where further research would reduce uncertainty.
Keep an assumption log: every input, its source, its date, its confidence level and the person who validated it. This makes the estimate auditable and easy to update as new information arrives.
6. Turn the market size into decisions
A market estimate is only useful if it informs a decision. Once the range is agreed, the next steps usually look at structure rather than size alone.
- Segmentation: which price tiers, regions and channels concentrate the volume and the growth.
- Competition: who holds the main shares according to distributors and retail observation.
- Route to market: which importers, distributors and outlet types can carry a new entrant.
- Price points: what consumers actually pay in modern and traditional retail.
This is often where field research adds the most value. The same distributor interviews and store visits used to size the market also reveal margins, payment terms, listing practices and the practical barriers a new brand will face.
Common mistakes to avoid
- Relying on a single published figure without checking its source, date and scope.
- Ignoring informal channels and traditional retail, which can carry a large share of sales.
- Using trade data without separating products grouped under the same code.
- Copying ratios from another country without adjusting for income and consumption habits.
- Presenting one precise number instead of a range with clear assumptions.
- Skipping field validation because desk figures look convincing.
How AMRC can help
AMRC supports companies, consulting firms and development organisations with market studies and market entry research across North Africa, the Sahel, West Africa and the Middle East. We combine desk research and trade data analysis with supply-side interviews, retail audits and consumer surveys, and deliver market estimates as transparent ranges with a documented assumption log, in English, French or Arabic.
Key takeaways
- Define the scope precisely before calculating anything.
- Combine top-down sources such as trade data with bottom-up field inputs.
- Importers, distributors and retail audits often provide the most reliable signals.
- Use proxies as checks, not foundations, and triangulate every estimate.
- Deliver ranges and scenarios backed by a documented assumption log.
Frequently asked questions
Top-down or bottom-up: which is better?
Neither on its own. Top-down is fast and gives an order of magnitude; bottom-up is more grounded but depends on field inputs. The most reliable estimates use both and examine the gap between them.
How reliable is trade data for sizing?
It is a useful starting point for import-dependent categories, but it has limits: product codes can be broad, informal flows are not captured and re-exports can inflate figures. It should always be cross-checked with importers and distributors.
How long does a market sizing study take?
As an indication, a desk-based estimate can take one to three weeks. Adding supply-side interviews, retail audits or a consumer survey typically extends the work to several weeks, depending on the number of countries and categories.
Why give a range instead of one figure?
Because in data-scarce markets every input carries uncertainty. A range with explicit scenarios shows decision-makers the real level of confidence and which assumptions most affect the result.
Need to size a market in Africa or the Middle East?
Tell us about your product and target countries, and we will propose a sizing approach, timeline and budget.
