Know it / 24 Digital Customer Journey
KNOW IT · 24
Digital Customer Journey
Where do customers drop off online?
We follow customers across your website, app and social media — screen by screen — to find where they drop off and what would keep them.

TIMING
3–5 weeks · indicative
UNIVERSE
Know it
SERVICE
24
LANGUAGES
EN · FR · AR
When teams call us
Business challenges
- Low online conversion
- High drop-off in the funnel
- Customer effort too high
- Digital channels to prioritise
What we test
- Website and app journeys
- Funnels and sign-up flows
- Social media touchpoints
- Customer service online
Who we test with
- Online customers
- Visitors who did not convert
- App users
- Target segments
RESEARCH METHODOLOGIES
Follow customers across website, app and social media — screen by screen.
Each study combines the right methods into one rigorous protocol, with action standards agreed before fieldwork.
Digital journey mapping
Map of every step and channel online.
Funnel & drop-off points
Where and why users abandon.
Session studies
Recorded and observed real sessions.
NPS, CSAT & CES
Experience KPIs linked to each step.
Key indicators
What we measure
- Conversion by step
- Drop-off points
- Customer effort (CES)
- Satisfaction (CSAT)
- NPS
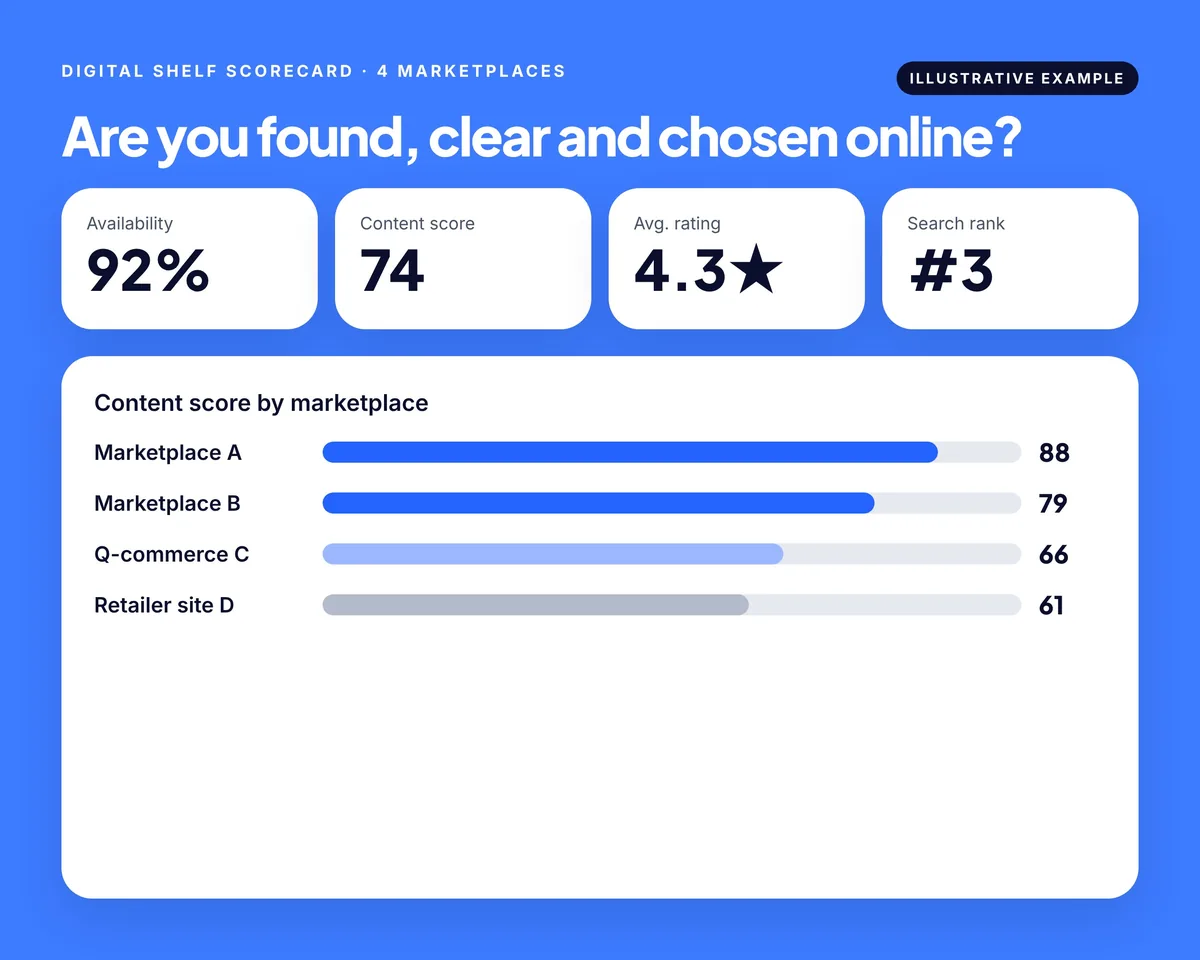
Illustrative results
What you receive
- Digital journey map
- Funnel diagnostics
- Prioritised fixes
- Session clips and verbatims
- Debrief with your team
Typical timeline
3–5 weeks
Indicative duration from brief to debrief. The exact timeline depends on markets, sample and method, and is confirmed in our proposal.
Week 1
Brief & design
Decision, criteria, sample and protocol agreed with you.
Fieldwork
Recruitment & testing
Real people recruited and tested in the right setting.
Analysis
Results & insight
Scores against your action standards, drivers and diagnostics.
Final week
Debrief
Clear answer, recommendations and next steps with your team.
Related services


KNOW IT · 25
Make store, screen and people work as one seamless journey — from QR code to checkout.